KPI gives you more insight into your store performance. View your KPI graphs in 4 simple steps below.
Step 1: Go to KPI Analysis page
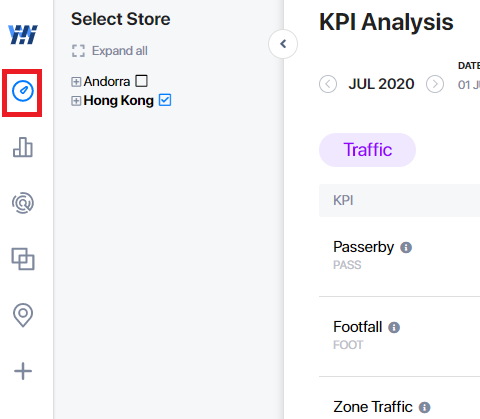
Step 2: Select the store(s) on the sidebar
Step 3: Click the KPI you wish to view more details on
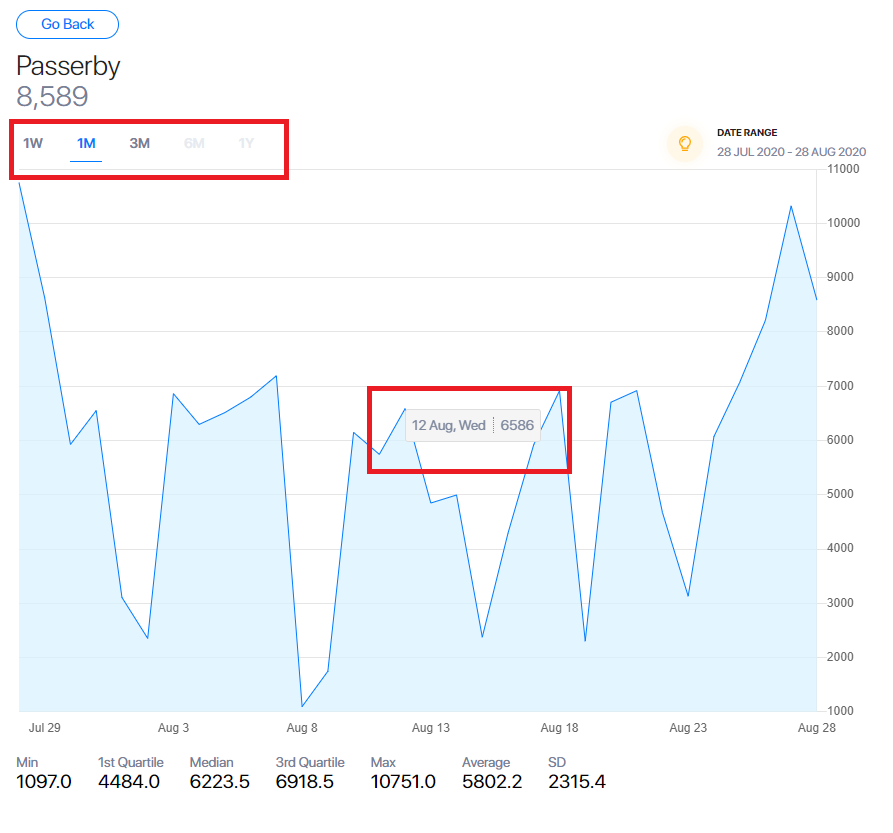
Step 4: Choose to view your data in different date ranges (1W, 1M, 3M)
Step 5: Hover over the points on your graph to see the exact statistics on a specific day
Related Questions: