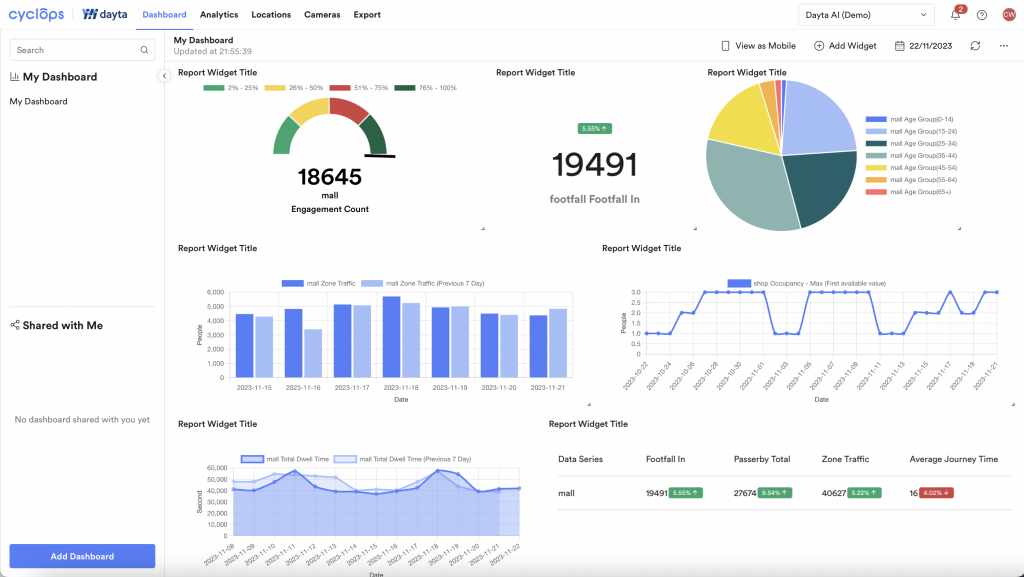
Dashboard is the home page you can see on Cyclops. It provides a centralized overview of data by displaying all widgets (i.e. charts and graphs) you have created.
Widgets are small, interactive components embedded within a dashboard that visualise data into trends and patterns.
By consolidating all kinds of data into a single interface, it enables you to monitor performance, track trends, and make data-driven decisions in a timely manner.
Related Questions: