Widgets allow you to visualise data with much more freedom and flexibility. In this tutorial, you are going to learn how to create a widget from scratch.
Before you start
You are advised to go through the tutorial for these items first before creating any widgets.
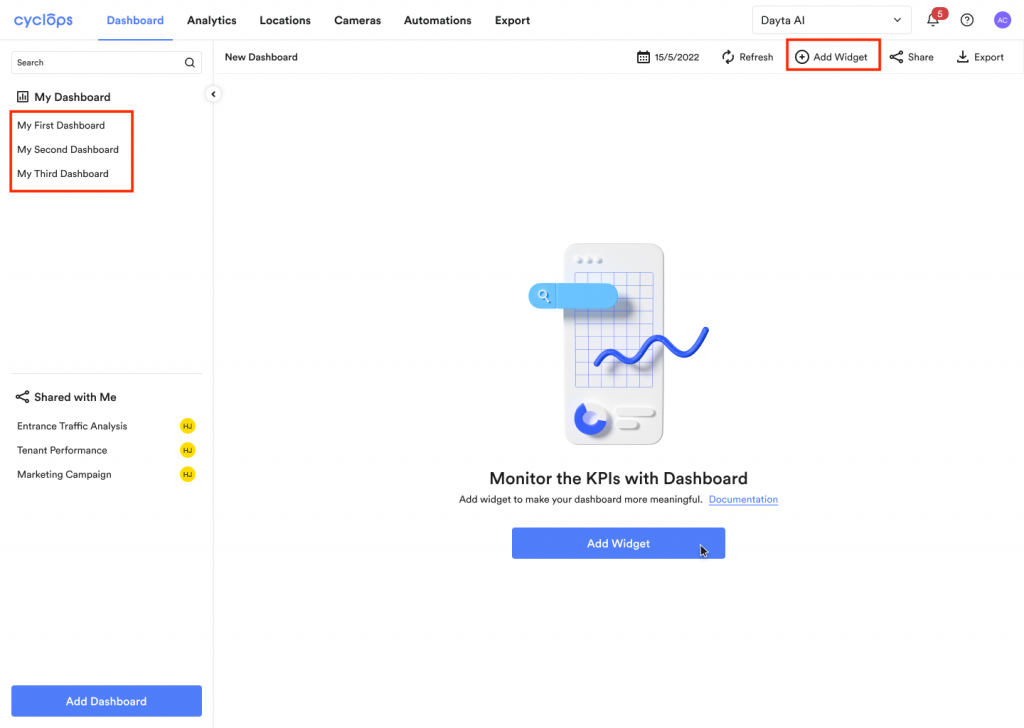
Step 1: In the Dashboard tab, enter your dashboard and click [Add Widget]
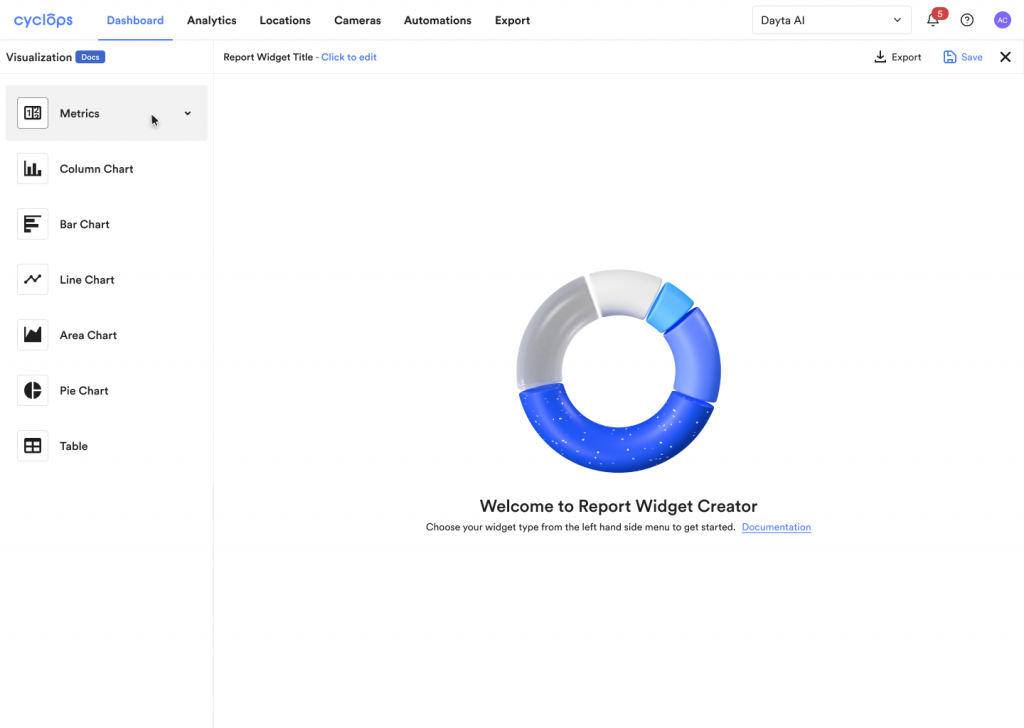
Step 2: Choose widget type
Step 3: Complete chart settings
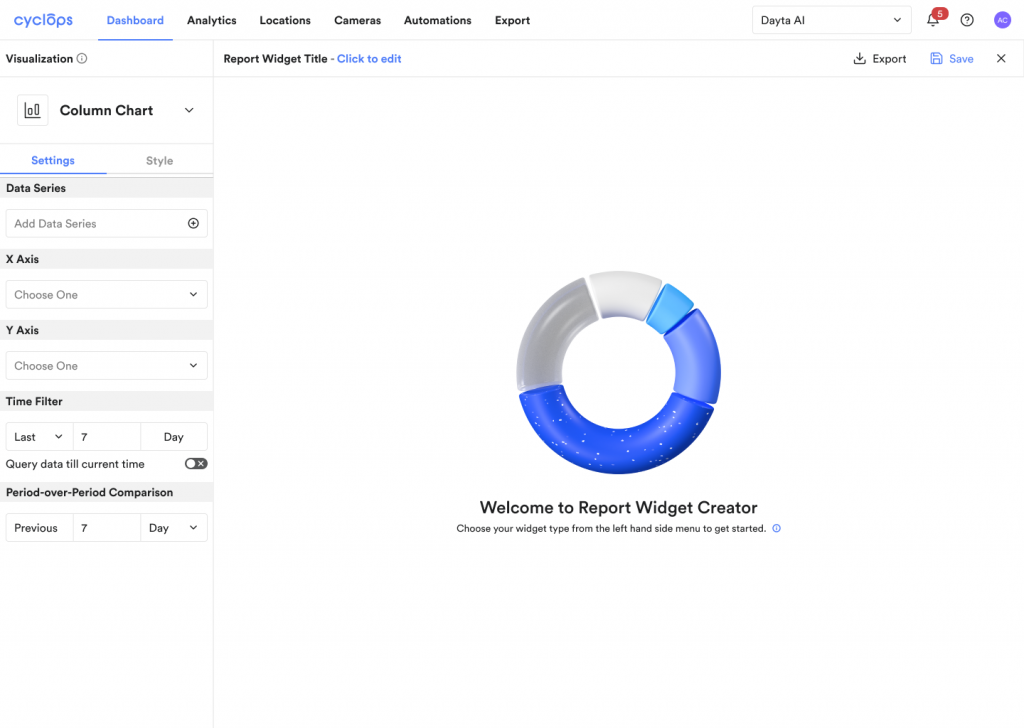
- Add data series (learn more)
- Set up XY axis (learn more) / Select data type
- Select time filter (learn more)
- Adjust Period-over-period comparison (learn more)
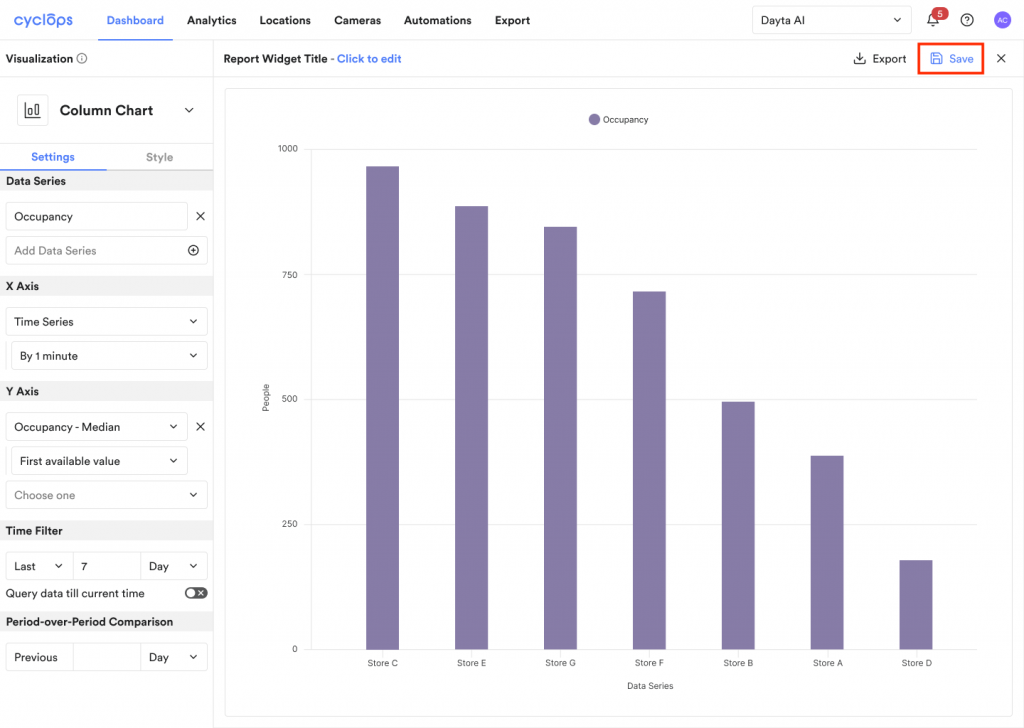
Step 4: Click [Save]
Related Questions: