In this guide, we will walk you through a brief introduction to all data types Cyclops can generate. Should you have any further questions, please feel free to contact us at all times.
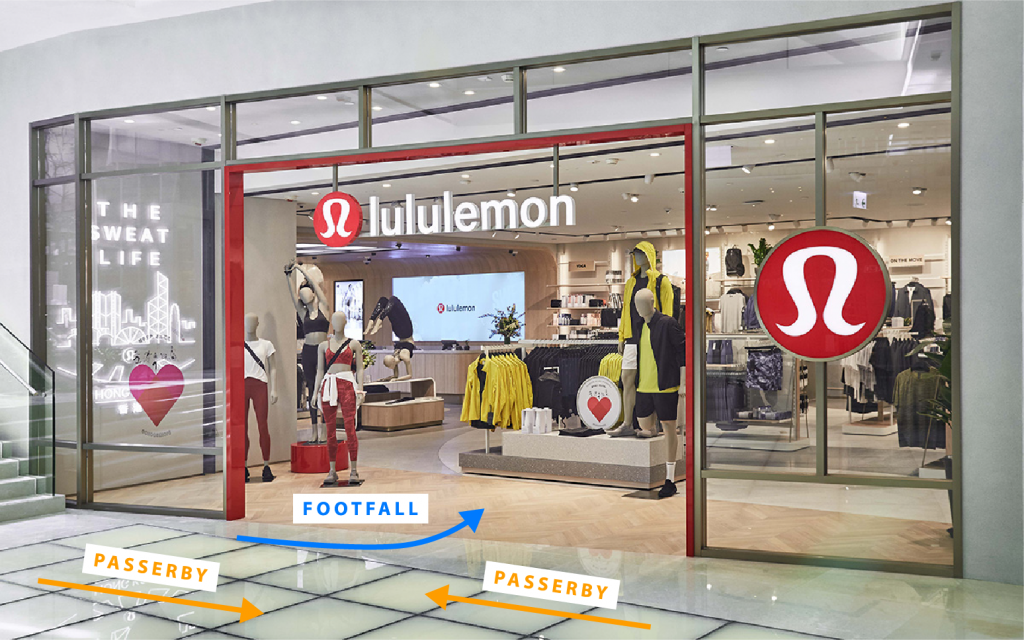
Footfall
The number of people that pass the footfall line from OUT to IN

Passerby Total
The number of people that pass the passerby line from A to B or B to A
This number can be splited in to Passerby A to B and Passerby B to A for visitor path analysis
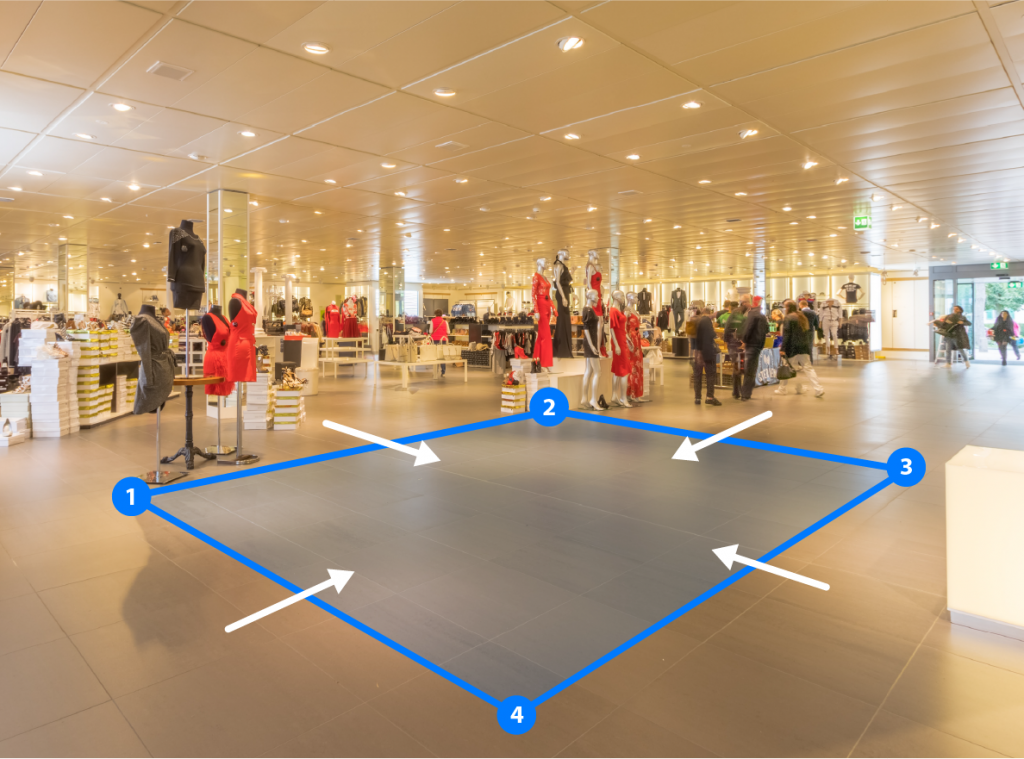
Zone Traffic
The number of people that enters the zone from all direction
Walk-in Rate (%)
The conversion rate of outside traffic into your shop visitors. Similarily as Click-through rate in the marketing sector, this number tells you the percentage of “clicks” (footfall) you get for the “impression” (passerby) you have
Footfall / (Footfall + Passerby) * 100%
The formula of walk-in rate
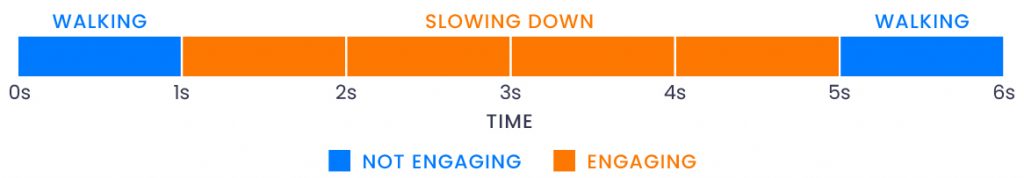
Engagement Count
The number of people engaged inside the locations/zones. Read more to see how we decide if a visitor is engaging or not.

Engagement Rate (%)
The conversion rate of zone traffic into an engaged one, serves as a crucial metric in evaluating location/zones promotion effectiveness
Engagement Count / Zone Traffic * 100%
THE FORMULA OF Engagement rate
Engagement Time – Average / Total
The avaerage or total engagement time spent inside the locations/zones by visitors. Read more about the detailed engagment time calculation.
Engagement Time Rate (%)
The percentage of engagement time to dwell time on average.
Engagement Time / Dwell Time * 100%
The formula of engagement time rate
Dwell Time – Average / Total
The average or total time spent inside the locations/zones by visitors

Gender (%)
The percentage of Male and Female visitor inside the locations/zones

Age Group (%)
A percentage classification of visitors into the age of:
| Age Group | 0-14 | 15-24 | 25-34 | 35-44 | 45-54 | 55-64 | 65+ |

Occupancy
Returns the number of people inside the zone in 1-min interval, available in Max and Median number.

Assume the following is the Occupancy number Cyclops can capture from the footage over a 1-minute duration
| Frame | 1st | 2nd | 3rd | 4th | 5th | 6th | 7th |
| Occupany | 1 | 2 | 2 | 3 | 2 | 2 | 2 |
The number to be saved in Cyclops database would be,
Occupancy Median = 2
Occupancy Max = 3